AML case study
ANTI-MONEY LAUNDERING
Uncovering the criminals’ hidden money

The company protects 500 million consumers by monitoring real time financial transactions. It processes 50 billion events a year and blocks 75% of fraud attacks.
The initiative
The company had a strong seller in its real-time card fraud offering and wanted to pivot it into an anti-money laundering (AML) solution.
My role
-
Design strategy
-
All user research
-
Participatory design workshops
-
Usability testing
-
Prototyping experiments
-
Hi-Fi click-throughs
The team
I joined the team as the sole Lead UX designer as planning got underway for the pivot. The team consisted of UI and server development teams, data scientists, tech comms and the product manager.
My process
This process is a blend of best practices and insights from diverse design experiences, offering a collaborative and flexible approach to identifying and solving design problems
Phase 1
Project definition & planning
-
Define the project scope, goals, and objectives
-
Outline the UX practices required to design the experience.
-
Set expectations for UX activities with stakeholders and team members
Phase 2
Research & discovery
-
User research
-
Personas
-
Journey maps
-
Comparative assessment
Phase 3
Concept development & vision setting
-
Synthesise research findings to define user goals, problems, and desired outcomes
-
Develop a design statement that aligns with the project’s “North Star”
-
Create initial concepts and sketches to bring the vision to life
Phase 4
Design & prototyping
-
Develop wireframes to detail product structure, layout, and functionality
-
Create prototypes that demonstrate user flows and interactions.
-
Conduct usability testing to gather feedback on design concepts.
Phase 5
Refinement & validation
-
Refine wireframes and prototypes based on usability testing feedback
-
Validate design decisions by ensuring they align with user goals and project objectives
-
Continue usability testing to optimise the design from the user’s perspective
Phase 6
Development support
-
Collaborate closely with the product owner and engineering team during development
-
Provide design clarifications and resolve emerging roadblocks
-
Ensure design integrity and usability are maintained during the build process
Phase 7
Launch & evaluation
-
Monitor the live product’s user experience in the real world
-
Audit user interactions and feedback to identify usability issues
-
Document findings in a prioritised backlog for future iterations
Phase 8
Iteration & improvement
-
Use feedback and analytics to identify areas for improvement
-
Implement iterative changes to enhance the user experience
-
Continually refine the product to meet evolving user needs and business goals
Project definition and planning
Business problems
Product management had clear business problems and goals.
Business problem
Reduce our customers’ exposure to damaging fines and negative headlines caused by breaching AML regulations.
Business goal
Financial growth
Increase the company’s annual and recurring revenue via an AML stream.
Market growth
Improve the company’s stickiness in the fintech market by ensuring AML transaction monitoring could be upsold to existing cards and payments customer
Design plan
Less clear were the user goals and outcomes so this plan was drawn up with the early emphasis on gathering this data.
Activity
Artefact
Duration
Interviewing AML agents/analysts (day in the life) in field if poss
Persona, pain points, user journeys, tools used, definition of job success
2-3 weeks + loop backs
Competitive review of existing solutions
Youtube videos, open-source literature, word of mouth descriptions
1 week
Interview workshops, review answers, group into insights, cluster pain points
List of prioritised pain points and unmet needs we want to design for
1 – 2 days
Concept workshop
Sketchboard (storyboard) – current, changed and future state
2 days
Eng, briefing on tech appraisal
Eng. Outline technical approach and scope of any constraints
1 day
Recommendation presentation
Deck on design approach, interlock with tech. Outcomes to be achieved. Next step
1 week
Iterate designs to show how the solution will look and function (includes validation and testing loops
Wireframes for workflows, case management interactions and information display
8 weeks
Hi–Fi prototype
Validate a final semi-functional model of the solution
4 weeks
Research & discovery
Research
Research began with identifying information goals the team could both relate to and would focus the activities on getting to a design point of view statement.
Research goals
Identify the key pain points AML analysts encounter in their workflows.
Understand any difference between tasks carried out by cards and payments analysts/agents and AML analysts
Gather insights into the tools and processes currently used by AML analysts.
Document any functional gaps that need to be covered from pivoting a cards offering into an AML solution
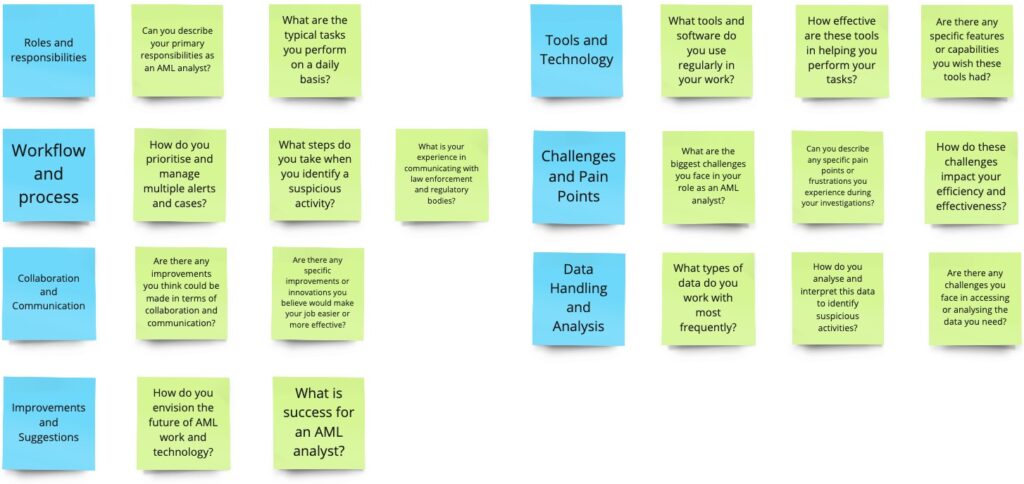
Question time
The core question set consisted of seven groupings of 19 questions.
Click image to expand image
Contextual inquiry
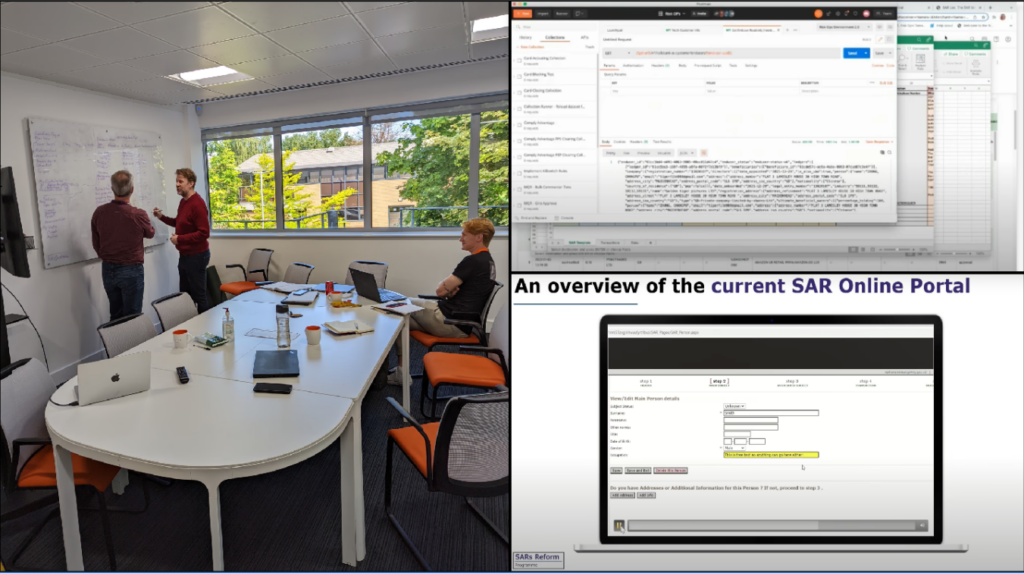
The research was subsequently boosted with the addition of in-person workshops with a leading financial crime consultancy, MWFC.
SMEs from MWFC attending a workshop and screen shots from contextual inquiry video calls with AML analysts.
Personas
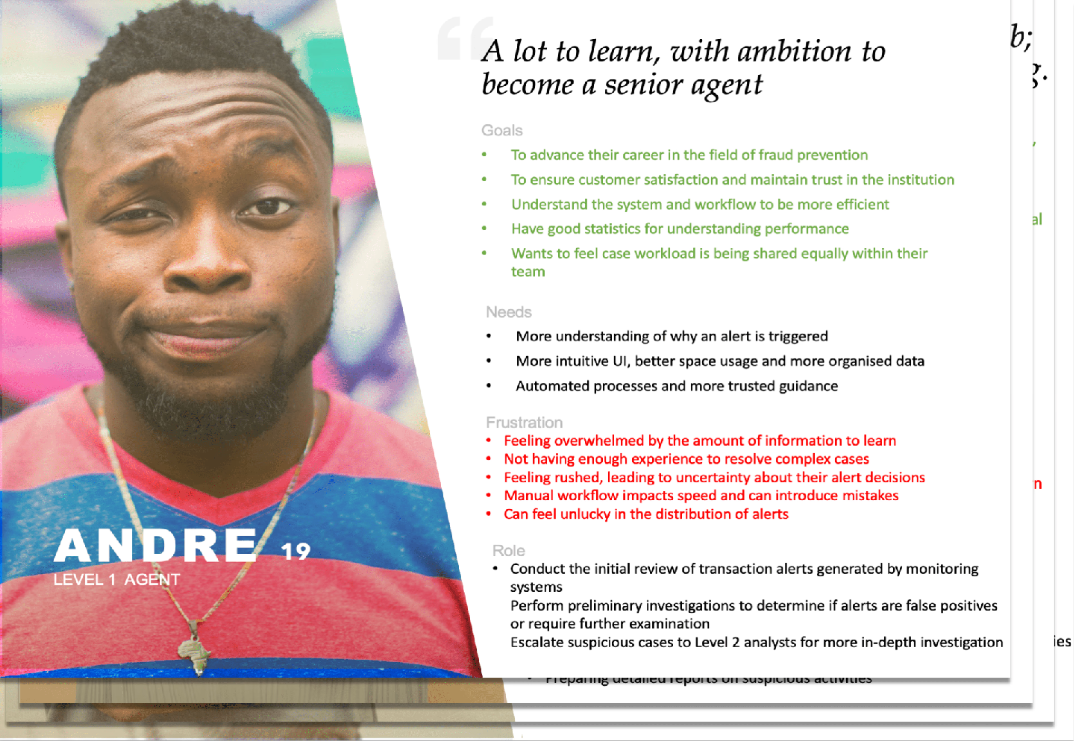
From the interviews I constructed four personas representing a Level one, two and three analysts and a money laundering reporting officer (MLRO)/supervisor.
Click image to expand image
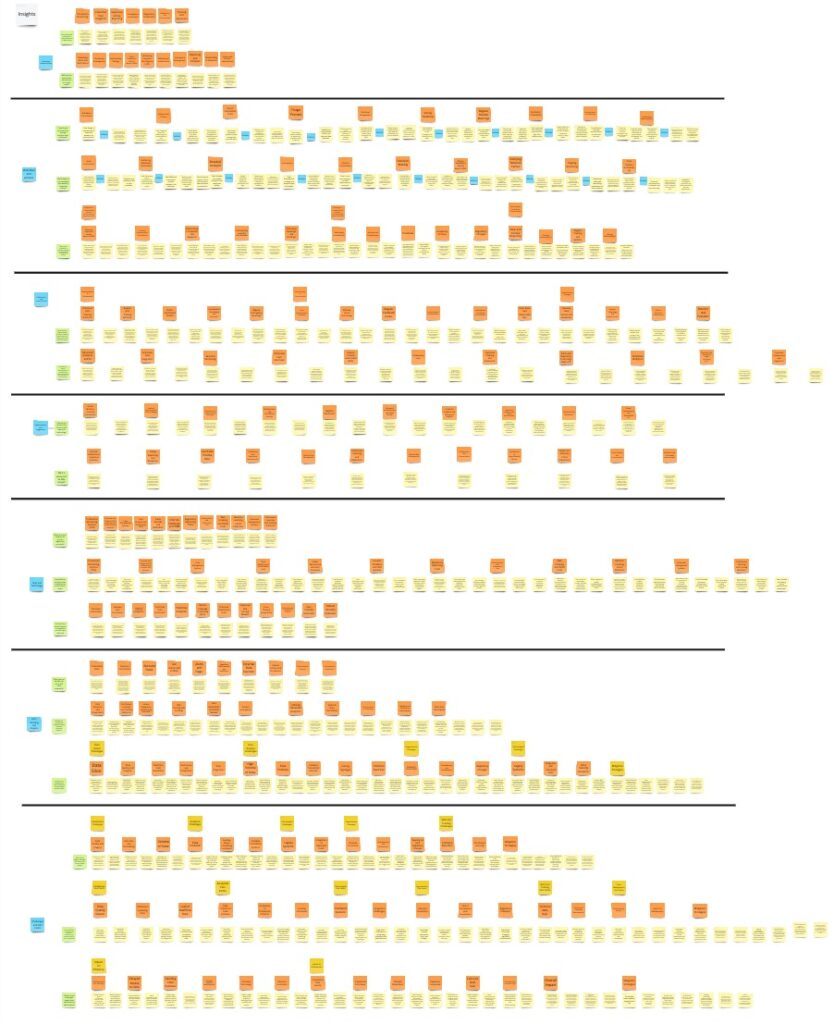
Identifying insights
As the answers came in we held a workshop and sorted the results into insights.
Journey mapping
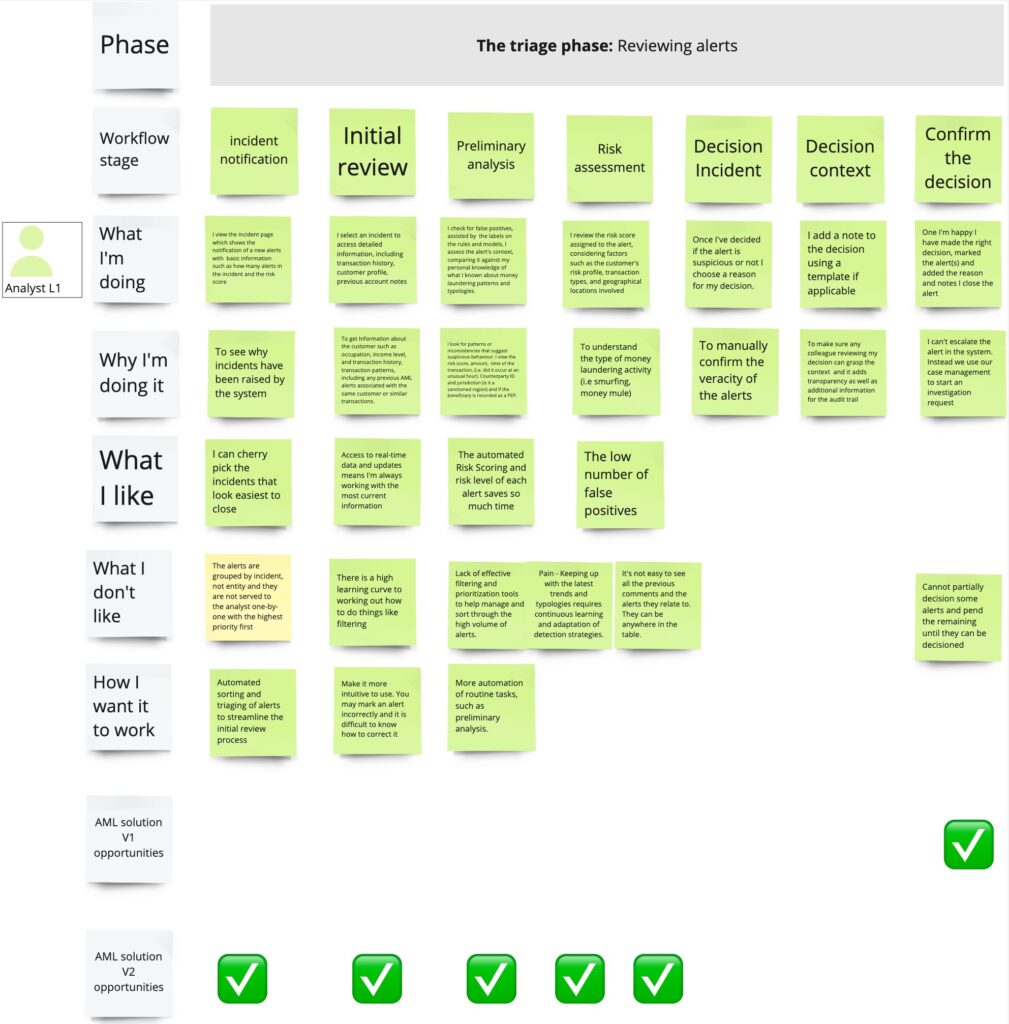
The contextual enquiry sessions were consolidated into an ‘As Is’ journey map using the talk aloud data to keep it centred on the user.
A section of the journey map with additional rows showing why the user is doing the activity, what they like and don’t like and how they want to work
Click image to expand image
Overview of the ‘As Is’ journey map.
Click image to expand image

Insights to pain points
Extract from a workshop to compare and group pain points pulled from the interview insights and those identified in the journey map.
Click image to expand image
Identifying functional gaps
The team assembled to compare capabilities of the existing card fraud solution to those identified in the journey map.
The four identified areas of unmet needs
No support for extending alert life
Events and alerts captured in the system needed to live beyond an immediate determination of risk or no risk, in fact even the terminology needed to change to escalate or discount.
No concept of alert triage escalation
AML analysts were governed by workflows based on escalation levels and workflows were not the same across organisations.
No case management provision
A case management system is required to run an investigation, capture ad hoc information and store events and alerts and that did not exist in the cards solution
No Suspicious activity report function
Where there are grounds, the reporting organisation needs to generate and file a suspicious activity report (SAR) to the authorities.
Sketching the vision
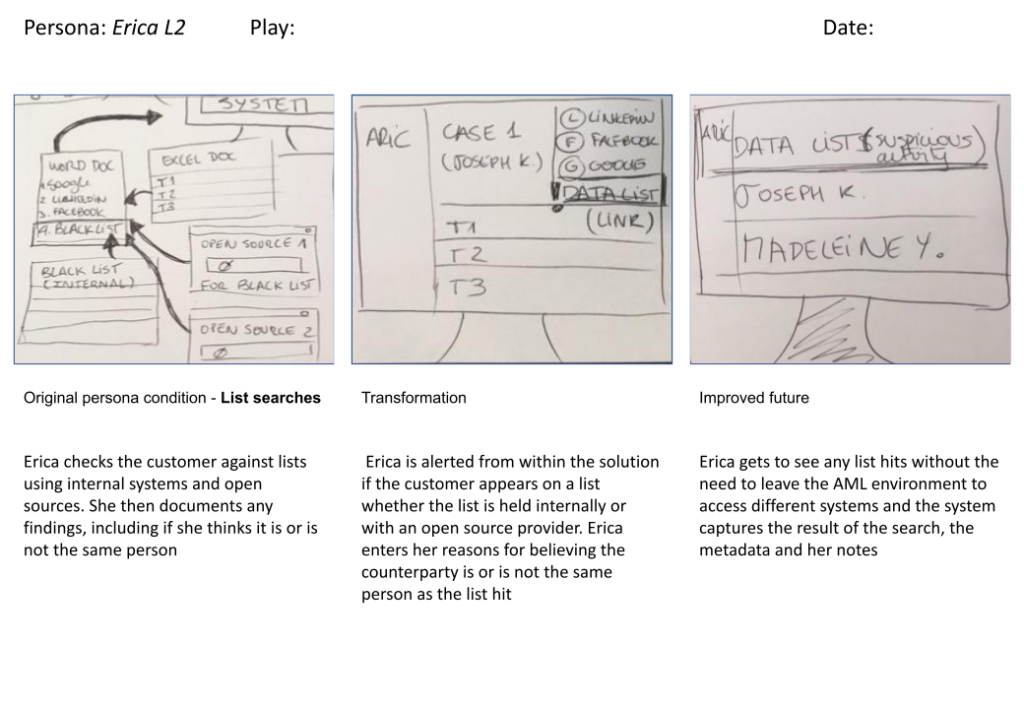
To help the team rally round a vision and form a North Star, I sketched a concept storyboard for the personas, depicting their current condition, a transformation state and the improved future.
The storyboard showed how stitching a new case management function into an existing UI could produce an acceptable user experience, if it was coupled with a decrease in false positive alerts. The outcome being a reduction in the analyst’s workload.
Click image to expand image
Emotion mapping
To accompany the storyboard, I put together a visualisation of the user’s emotional journey to show the improvement across the tasks.
Click to expand image
Concept development & vision Setting
The design point of view
I wrote up a design statement to recap the insights and pain points from the data, what the design would do to resolve them and ensure the team and stakeholders were on the same page and agreed on the North Star.
Design goals
Our goal is to provide an end-to-end feature set for attending to AML alerts, undertaking investigations and collating the data necessary to file a suspicious activity report. Our users will experience the proven fraud detection of our machine learning but now integrated into a workflow that steps from triage to case creation within the same page and gives the user the tools they need to support the building of a case as the investigation progresses through to case closure.
Features and functions
There will be no modifications to the features offered in the AML solution version one. The additive features will be:
-
Case management including case status and duration, number of alerts and types of entities in the case.
-
Document uploads, audit capture of case actions and value of transactions in the case.
-
Workflow including case creation, adding individual alerts and events to a case, escalating a case and closing a case.
Success criteria
We believe achieving the following measurable outcomes* will reduce the risk of the solution disappointing the users and customers and indirectly support the achievement of the company’s stated financial goals.
Alert reduction
10% Reduction in total alerts for the level one analyst to work.
Prioritisation
20% improvement in investigation effectiveness compared to the current AML baseline.
Analyst Productivity
15% increase in analyst efficiency over the aggregated AML baseline.
Analyst Satisfaction
Record a SUS score of 70 or higher in analysts’ satisfaction with the new workflow and case management features.
How will our users feel
Our users will feel empowered to be more productive as the system allows them to quickly navigate through alerts, prioritise tasks, and manage their workload efficiently. They will experience new levels of efficiency and expend less mental allowing them to handle cases systematically, reducing the time spent on each alert. They will become more effective with Integrated compliance features and checklists ensuring they reduce mistakes, meet regulatory requirements, and cut the anxiety caused by potential compliance issues. Our analysts will be able to enjoy doing what they signed up to do: meaningful work preventing money laundering. They will feel happier coming to work and they will not hesitate recommending the system to prospective customers.
Constraints
The UI design is not modular. There are areas of the UI that are dependent on other areas. It is not possible to insert significant functionality without considering a re-design. Areas such as the events table are bespoke and contain key controls. While it is possible to add to the controls it is not possible to redesign the interaction patterns and remove them from the table without considerable cost and time.This is a significant constraint on the harmony of the user experience as it requires additional buttons to be added into the data rows of the table with the risk of confusing the user.The proposal is to work within the constraints, provide extended help to assist with the learnability and address the interaction and visual design refresh at the next version.
Personas
Primary personas will be:
- Andre, Level one analyst
- Erica, Level two analyst
- Ivan, Level three analyst
Secondary personas will be:
- Sumitra, MLRO
*Extrapolated from a baseline aggregation of results from previous ARIC Risk Hub deployments.
Design & prototyping
To anchor the detailed work, we used the How Might We framework.
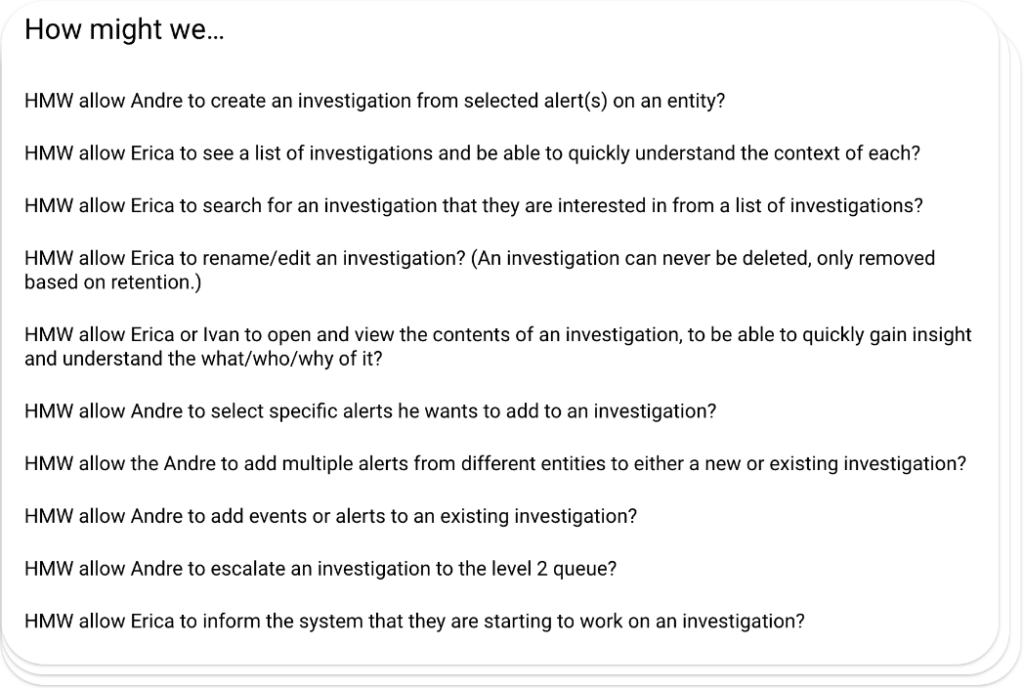
Task flows
I created task flows for the how might we statements, initially sketching the wireframes.
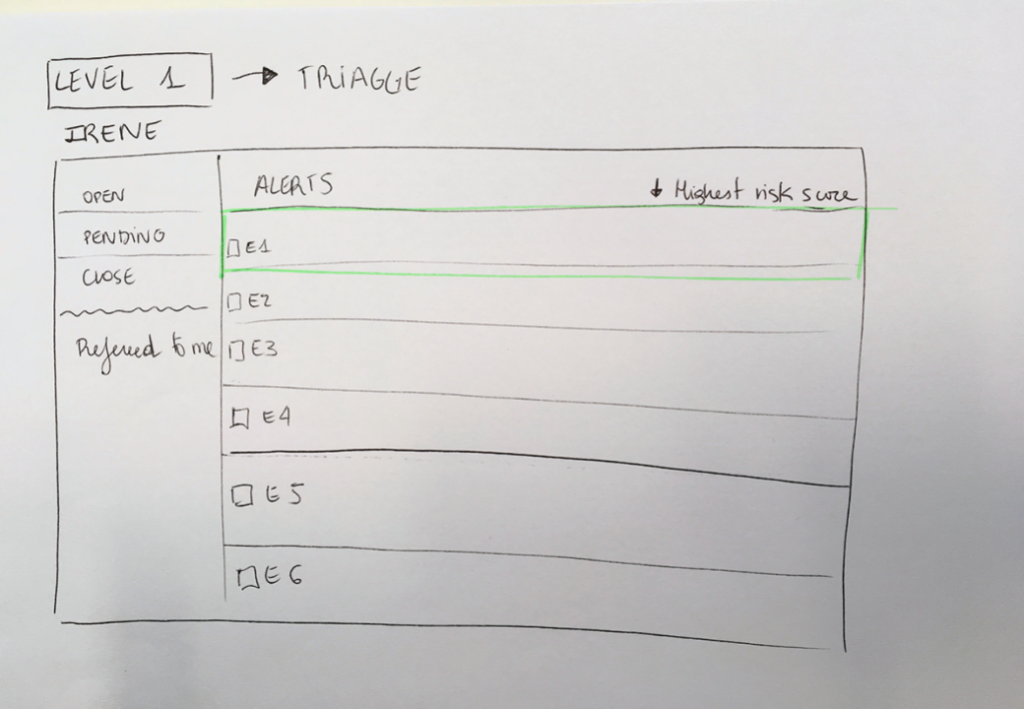
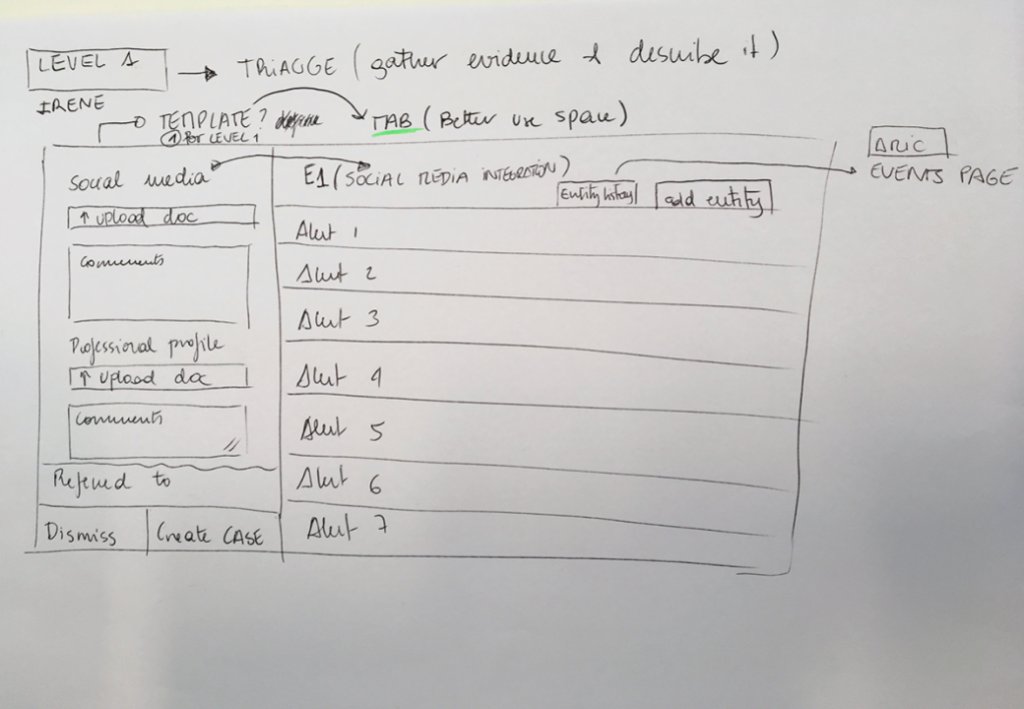
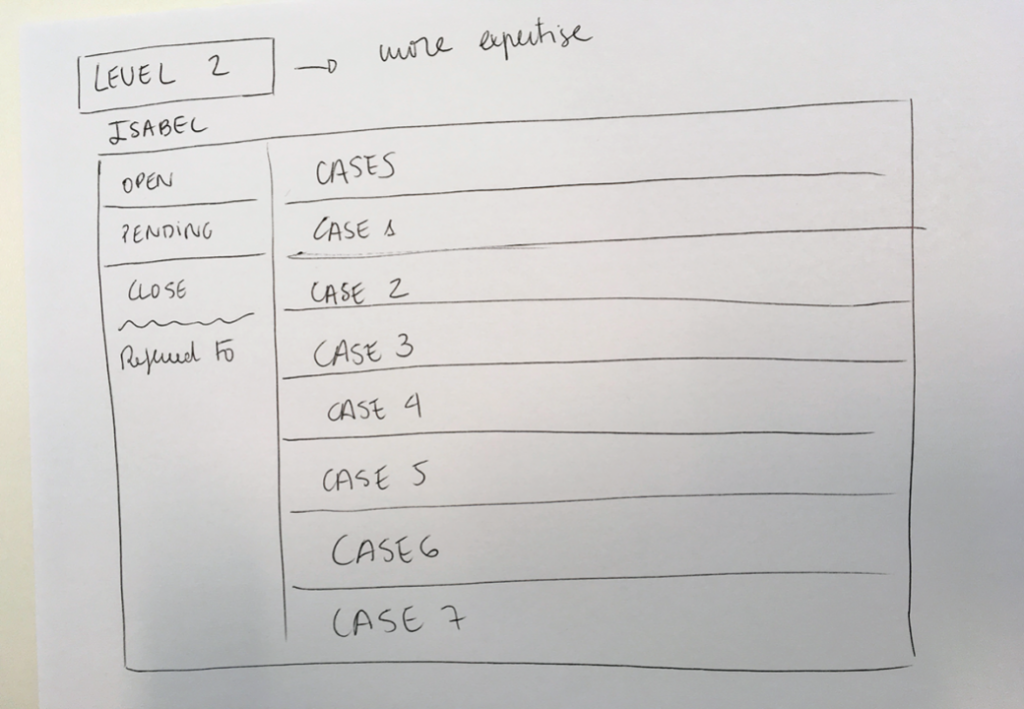
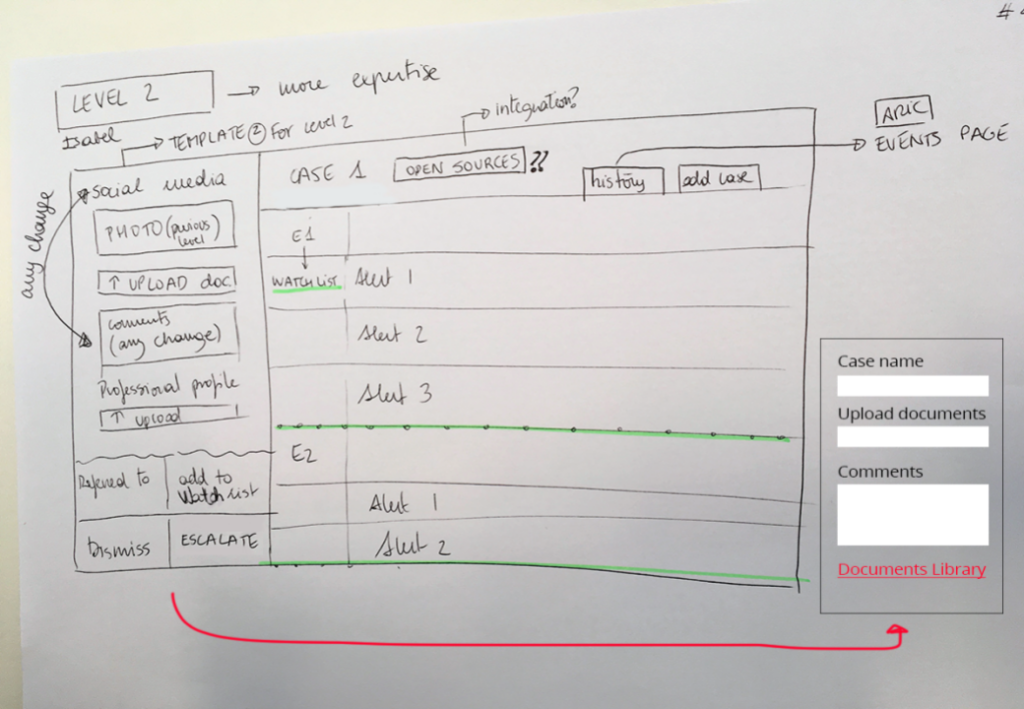
As the design evolved the task flows took on more fidelity.
Example of a task flow scenario for a how might we statement
Testing and validation
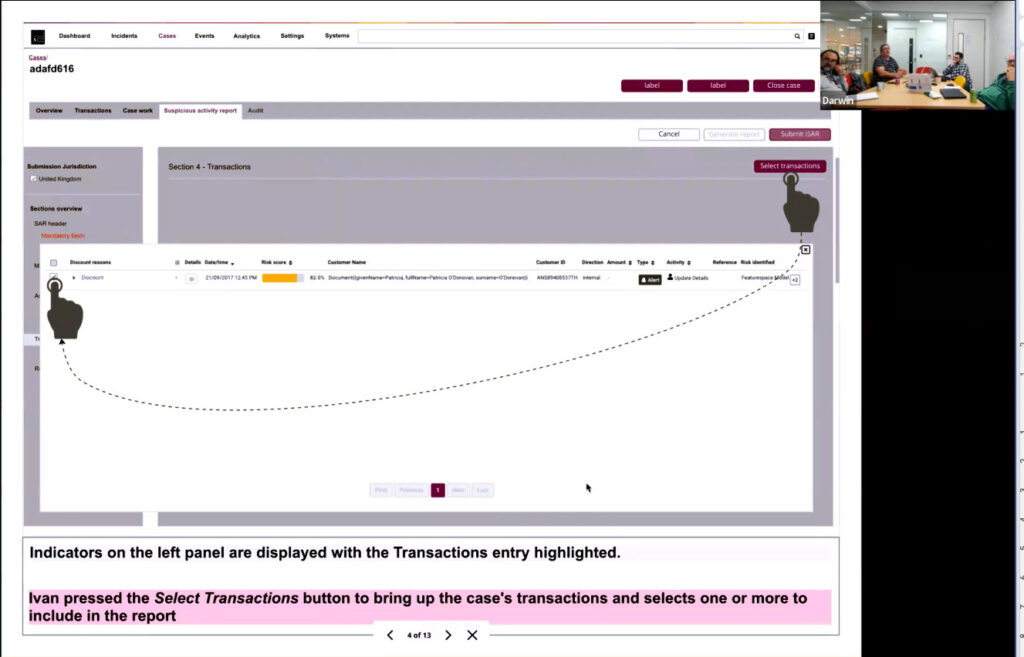
Regular validation sessions were run with SMEs and end users. These took the form of show and ask sessions with a standard set of questions.
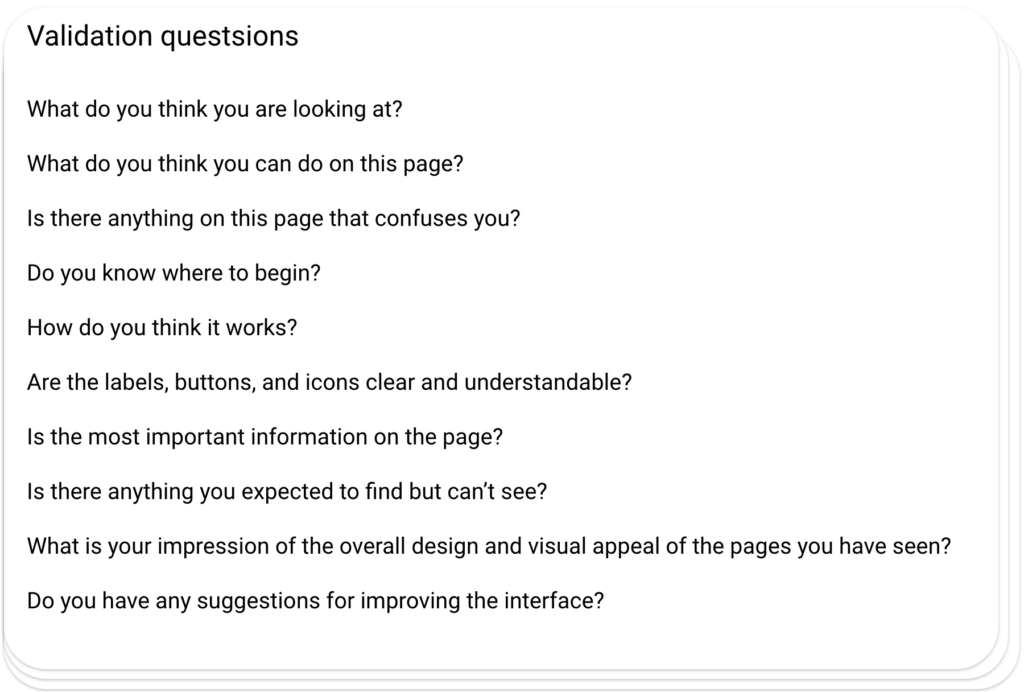
An overview of the completed set of task flow scenarios linked together to support a breadth of validation sessions.
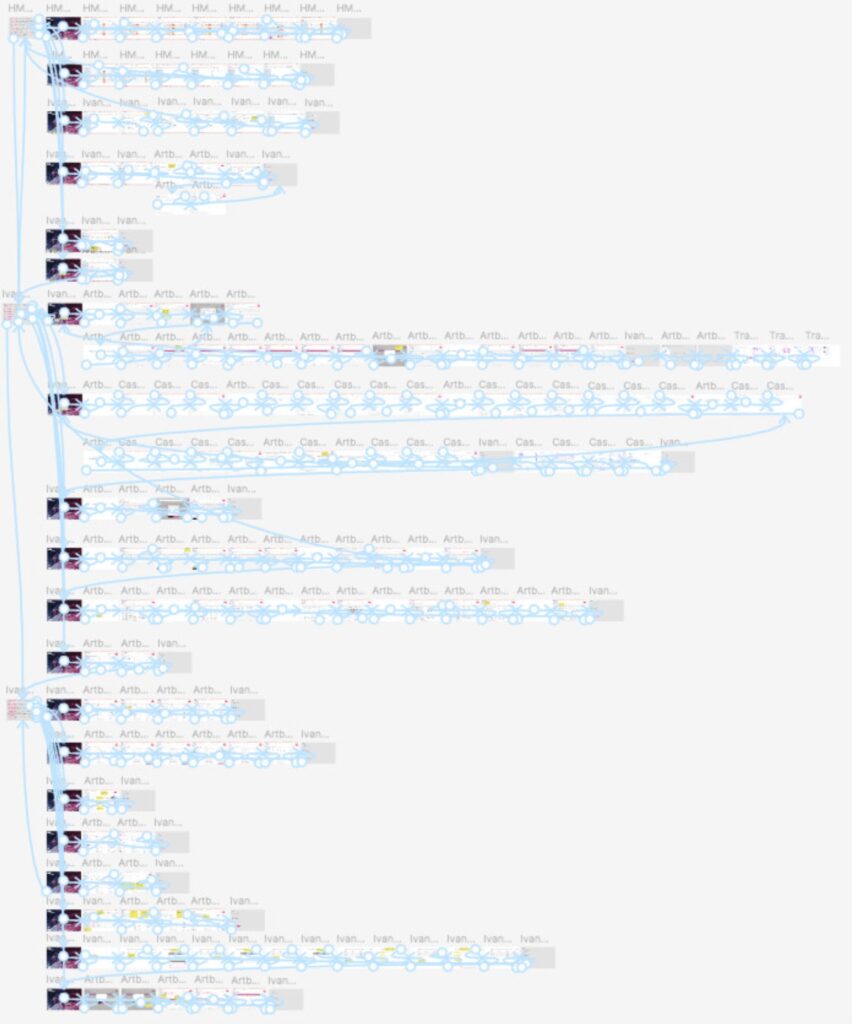
The team validating with users
A validation session with end users. On screen is a task flow for Ivan, the Level 3 analyst, with members of the development team watching on.
Click image to expand image
Refinement & Validation
Formal testing
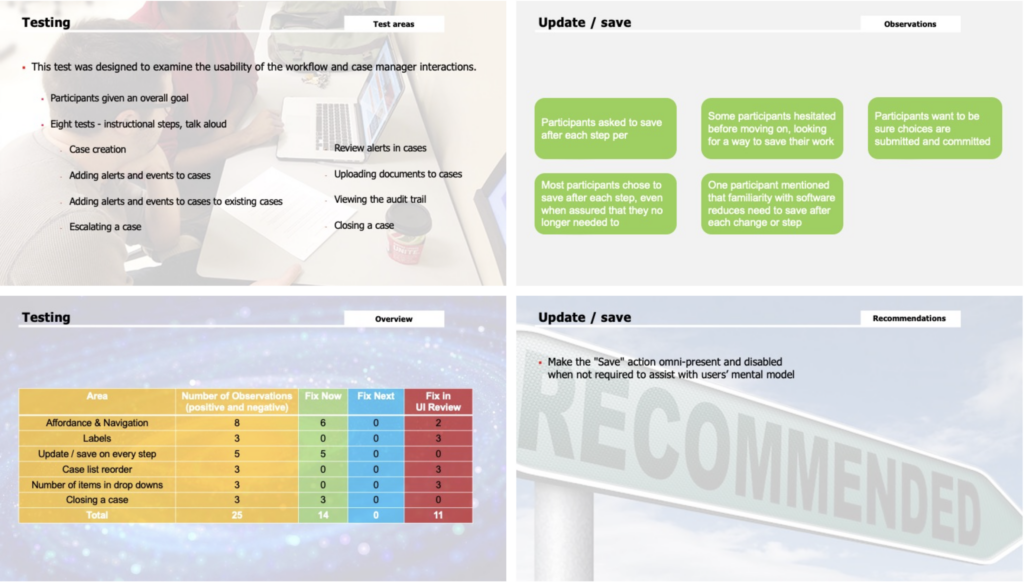
Testing became more formal as the initiative moved into hi-fi prototypes with task based testing replacing questions. For transparency, data from testing was included in stakeholder updates.
Click image to expand an example selection of slides from a usability test.
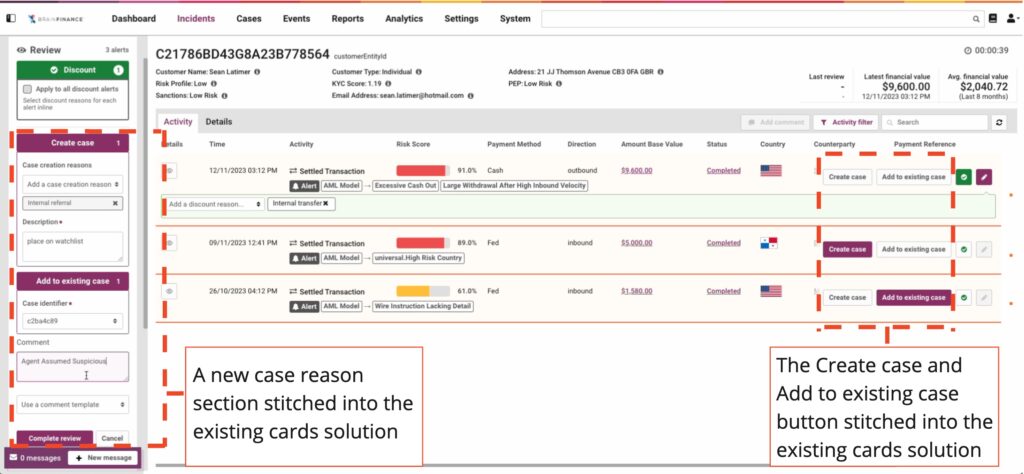
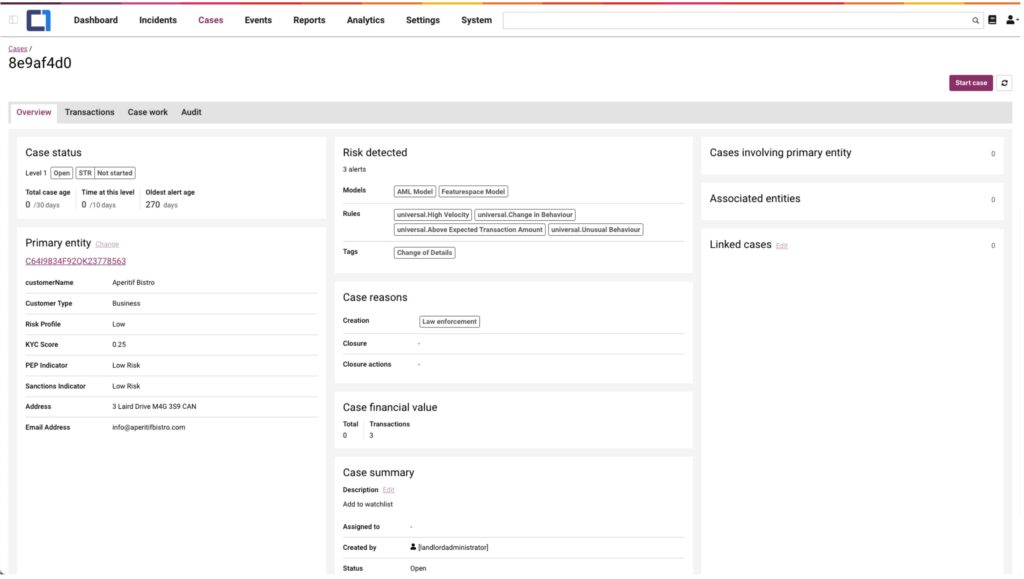
Stitching the new into the old
The red boxes indicate where the start of the case management workflow was leveraged into the card fraud legacy UI.
It was not possible to harmonise this phase of the experience with the users’ expectations. The price of the constraints meant more buttons, more actions and more decisions for the user to deal with.
Click image to expand
Case management and workflow additions
The case management interface streamlined the user’s activities. In line with a wider design strategy, a modular UI pattern was used for composability across a number of solutions.
Click image to expand
The released design
Video from a playback showing the case creation and escalation journey.
https://martin-nathan.com/wp-content/uploads/2024/06/AML-video.mp4
Outcome
Business goals and user outcomes
Pivoting from the card fraud solution was a challenging situation from which to deliver on the business and user goals.
The strategy taken was to double down on the research, work with users and build up the data to identify where we could have the most meaningful impact on their journey given the constraints on design.
Overall the strategy proved effective. Customers and users experienced a real difference in the effectiveness to detect and action money-laundering alerts. Early adopters gave the company confidence to commit further investment which allowed a redesign to be factored into a wider design upgrade strategy for all solutions.
Business outcomes
Financial growth
- Version one was taken up by three early adopters which included two tier 1 banks.
Market growth
- One early adopter was an upsell.
Delightful experience
- The AML solution has now undergone a redesign and continues in the market.
User outcomes
Prioritisation
-
All alerts which generated a suspicious activity report were in the top 5% of the prioritised workload.
Productivity
-
95% reduction in false positives
-
33% of suspicious activity reports were identified and processed one month earlier than the comparative baseline.
Analyst Satisfaction
-
Five analysts completed SUS forms. Adjusted against sample size research, the median SUS score was in the range 63 (worst) to 74 (best).

