Predictive policing case study
PREDICTIVE CRIME ANALYSIS
Making neighbourhoods safer by predicting crime and deterring criminals
Smarter Cities is a part of IBM’s Smarter Planet initiative. It was created to help cities become more efficient, sustainable, and responsive through the use of data and technology. The initiative focuses on leveraging big data, analytics, cloud computing, and IoT (Internet of Things) technologies to address urban challenges across seven areas including public safety.
The initiative
A major police department’s resources were being stretched by social and economic factors while its budget was shrinking.
The department had been targeting a reduction in burglaries by seeking to understand where and when they were most likely to occur, but the project had failed to yield the expected impact.
The Predictive Crime Analytics solution was created to assist in predicting criminal events and locations. It began initially as a proof of concept before moving from field trials to general availability.
My role
-
Design strategy
-
All user research
-
Design workshops
-
Usability testing
-
Prototyping experiments
-
UI design
The team
I joined the proof of concept team at its initiation, working with a small development, a technical architect, data scientists and the product manager.
My process
This process is a blend of best practices and insights from diverse design experiences, offering a collaborative and flexible approach to identifying and solving design problems
Phase 1
Project definition & planning
-
Define the project scope, goals, and objectives
-
Outline the UX practices required to design the experience.
-
Set expectations for UX activities with stakeholders and team members
Phase 2
Research & discovery
-
User research
-
Personas
-
Journey maps
-
Comparative assessment
Phase 3
Concept development & vision setting
-
Synthesise research findings to define user goals, problems, and desired outcomes
-
Develop a design statement that aligns with the project’s “North Star”
-
Create initial concepts and sketches to bring the vision to life
Phase 4
Design & prototyping
-
Develop wireframes to detail product structure, layout, and functionality
-
Create prototypes that demonstrate user flows and interactions.
-
Conduct usability testing to gather feedback on design concepts.
Phase 5
Refinement & validation
-
Refine wireframes and prototypes based on usability testing feedback
-
Validate design decisions by ensuring they align with user goals and project objectives
-
Continue usability testing to optimise the design from the user’s perspective
Phase 6
Development support
-
Collaborate closely with the product owner and engineering team during development
-
Provide design clarifications and resolve emerging roadblocks
-
Ensure design integrity and usability are maintained during the build process
Phase 7
Launch & evaluation
-
Monitor the live product’s user experience in the real world
-
Audit user interactions and feedback to identify usability issues
-
Document findings in a prioritised backlog for future iterations
Phase 8
Iteration & improvement
-
Use feedback and analytics to identify areas for improvement
-
Implement iterative changes to enhance the user experience
-
Continually refine the product to meet evolving user needs and business goals
Project definition & planning
Business problems
Product management had clear business problems and goals.
Business problem
Give police departments a solution to provide on-going information to patrol officers on where and when they should position themselves during their shifts to provide the maximum deterrent to criminals.
Business goal
Act as market primer
Stimulate a bigger conversation with law enforcement
Generate lead generation
Design plan
To make sure the team focussed on the right users and identified the right problems I rolled a straw man design plan that called out the activities likely to help.
Activity
Artifcat
Duration
Interview workshop ( Review answers, group into insights cluster pain points)
Persona, pain points, user journeys, tools used, definition of job success
4 weeks
Competitive review of existing solutions
List of prioritised pain points and unmet needs we want to design for
2 days
Concept workshop
Sketchboard (storyboard) – current, changed and future state
1 week
Eng, briefing on tech appraisal
Eng. Outline technical approach and scope of any constraints
2 days
Data science pov
Data science to provide appraisal of feasibility
2 months
Recommendation presentation
Slide on design approach, interlock with tech and data science. Outcomes to be achieved and next steps
1 week
Iterate designs to show how the solution will look and function (includes validation and testing loops)
Wireframes for workflows, case management interactions and information display
2 months
HI –fi prototype
Validate a final semi-functional model of the solution
1-2 weeks
Research & discovery
Research
The team had experience with law enforcement solutions but this project was an unknown, so I took an approach with a bias to field studies and interviews with primary and secondary personas to understand the lack of current success and identify potential opportunities for solving any problem(s).
Research goals
Pinpoint why the department’s current methods are not delivering the expected outcomes.
Work with data scientists to understand the extent (and constraints) of their work and options for displaying model outputs.
The key challenges and obstacles faced by primary and secondary personas in their daily tasks in crime prevention.
Understand the impact of these challenges on the quality and effectiveness of crime analysis.
Product management press release – projecting future success
The product manager helped focus the team by writing a press release describing what a successful solution would achieve.
FOR IMMEDIATE RELEASE
Revolutionary Predictive Policing Solution launched in the City to combat burglary epidemic.
In an unprecedented move to enhance public safety, the City announces the launch of a groundbreaking predictive policing solution designed to forecast and prevent burglaries.
This state-of-the-art technology, the first of its kind, will provide real-time insights into potential burglary hotspots, offering law enforcement a proactive tool to combat crime and protect communities.
Developed in collaboration with leading data scientists and law enforcement experts, the predictive policing solution leverages advanced machine learning algorithms to analyse a multitude of data points, including historical crime data, socio-economic indicators, and real-time environmental factors.
By identifying patterns and trends, the system predicts when and where burglaries are most likely to occur, enabling police to deploy resources more efficiently and effectively.
Real-Time Crime
ForecastingProvides up-to-the-minute predictions of potential burglary hotspots, allowing for timely and targeted police interventions.
Data-Driven
InsightsUtilises a vast array of data sources to deliver accurate and actionable insights, helping law enforcement stay ahead of criminal activities.
Community Safety Enhancement
Aims to reduce burglary rates by up to 30% within the first year, contributing to safer neighbourhoods and enhanced quality of life for residents.
Contextual inquiry
I spent three days at the police department undertaking field studies shadowing a crime analyst, shift sergeant and patrol officers.
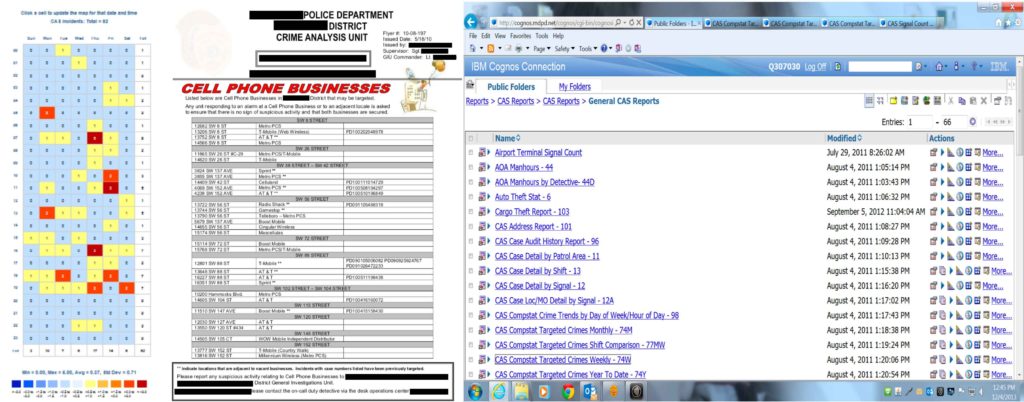
Field study artefacts
Artefacts from the field study, such as this screenshot from a training system, helped to later build up a picture of available information and challenges with manual data manipulation.
Click image to expand artefacts collected from the PD
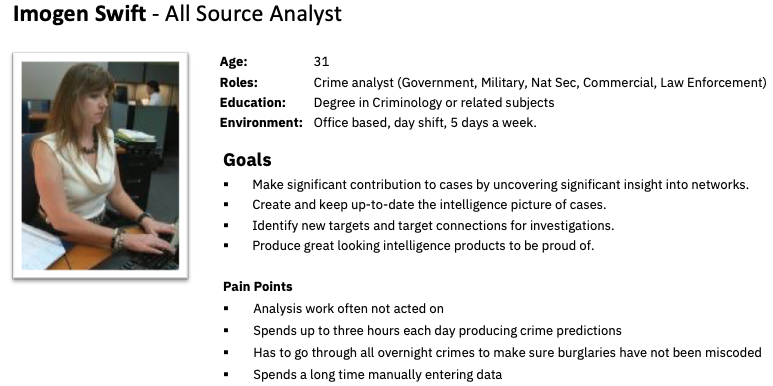
Personas
I used the research to create personas for the analyst, sergeant and patrol officer to help bring their world of pain back to the team.
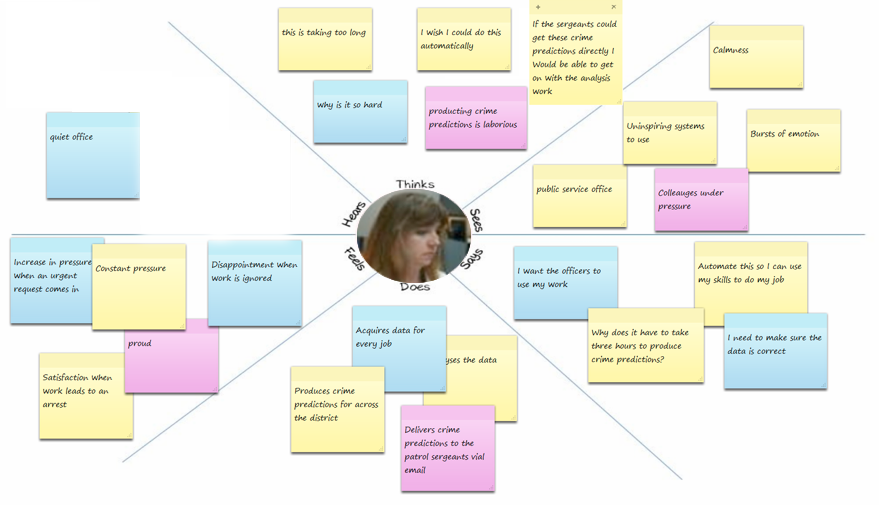
Empathy mapping
The observational information was recycled to create empathy maps, capturing the thoughts, feelings, actions and complexities of the users in their working environments. These would become a well-used source for identifying conflicts in our proposed solutions between personas and their tasks.
Click image to expand
Identifying functional gaps
The contextual interviews and observations with the analyst drew out key pain points.
Primary constraints
Single point of failure
The police department had one analyst assigned to the task of burglary analysis. The systems were too complicated to be picked up and learnt without significant time investment.
Faltering crime prevention
If the analyst was not at work the analysis did not get done.
Manual work impacting time
The analyst was required to do manual data entry which took up valuable analysis time.
Slow results
It took the analyst three hours to perform the analysis with results delivered to the frontline near midday.
Comparative task analysis
I was surprised at the lack of a smoking gun pointing to why the analysis was not having the expected outcome. All that was to change however.
In interviewing warranted officers, it emerged the analysis output was not reaching patrol officers until 11am at which point their attention was focussed on current activities and tasks assigned by the duty sergeant.
Without the analyst’s emails being acted upon, their efforts were never going to impact the burglary crime figures.
To give the team an overall picture, I created corresponding user flows so they could see the pain points as they occurred during the work day of the analyst, sergeant and patrol officer.
Click image to expand

Prioritise for maximum impact
We formed an assumption that a combination of earlier arrival of information and mechanisms to introduce the information via a command structure offered the richest area to explore.
The sergeant persona emerged as the king maker, linking the analytical output to the patrol officers and providing them with orders for the day.
Another significant pain point we had to address was the single point of failure brought about by the police department’s reliance on one analyst to produce the burglary predictions.
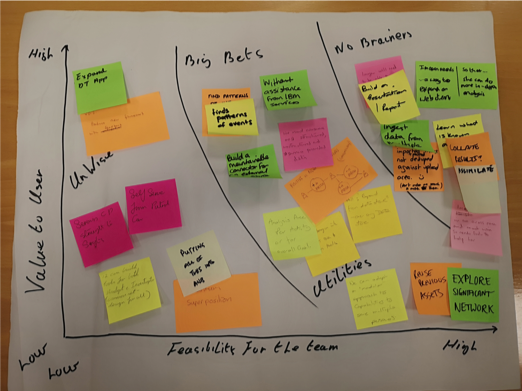
We held a workshop to put together what the research suggested our users’ perfect day might be like. From the workshop we built a prioritisation grid to view the ideas through the lenses of:
- User value
- Business value
- Feasibility
The grid allowed the team to filter out unwise ideas, earmark no brainers and plot the big ideas by both importance to the user and feasibility.
Click images to expand
Concept development & vision Setting
Sketching the vision
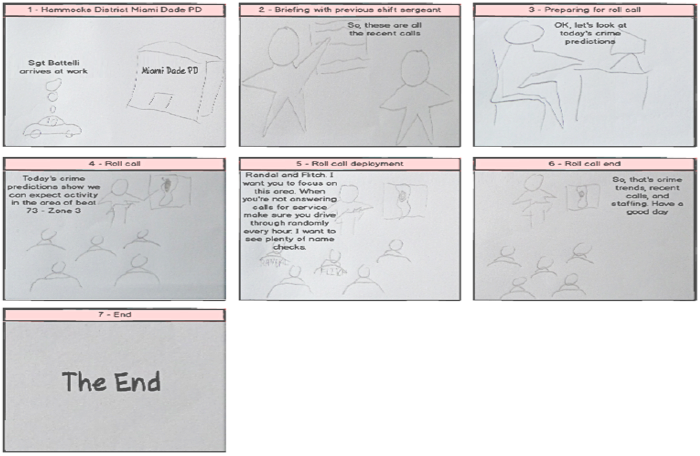
Taking the output of the prioritisation grid I created scenarios for the analyst and sergeant. The team then validated the scenarios through playbacks with the users.
Click image to expand
The design point of view
I wrote up a design statement to recap the insights and pain points from the data, what the design would do to resolve them and ensure the team and stakeholders were on the same page and agreed on the North Star.
Design goals
Our goal is to develop a system for accurate and repeatable predictions for crime activities and times.Police departments will experience a drop in crimes.Neighbourhoods will feel an increase in safety.Patrol officers will receive the predictions before the start of each shift, allowing for briefings before they start patrols.Crime analysts will have their data capture and analysis automated, giving them back shift time for driving better resource allocation.
Features and functions
Crime forecasting by district, by time
Patrol pattern suggestions
Prediction breakdown by crime type
Historic crime pattern overlays, by year and crime type.
Success criteria
We believe achieving the following measurable outcomes* will reduce the risk of the solution disappointing the users
Burglary reduction
10% Reduction in reported cases.
Prioritisation
80% improvement in resource allocation during shifts.
Crime analyst productivity
Removal of single point of failure in predictive analysis.
How will our users feel
Our crime analyst users will feel their work has been worthwhile and not ignored by the warranted staff.
Our shift sergeant will feel empowered to direct their patrols with data backing their plans.
Our patrol officer will feel they are getting the intelligence they need when they need it to prevent crimes happening.
Constraints
The designed solution will be an addition to Smarter Cities Intelligent Law Enforcement offerings and will use the One UI design system.
Personas
Primary personas will be:
- Imogen, all source analyst
- Silvester, Shift sergeant
Secondary personas will be:
- Pacey , Patrol officer
Refinement & validation
To anchor the detailed work, we created How Might We statements

Prototyping and taskflows
Focusing on the potential for a single point failure, the solution would need to provide a walk-up-and-use or training wheels interface for supporting on-boarding of first-time users that could step into the analyst’s role, if needed.
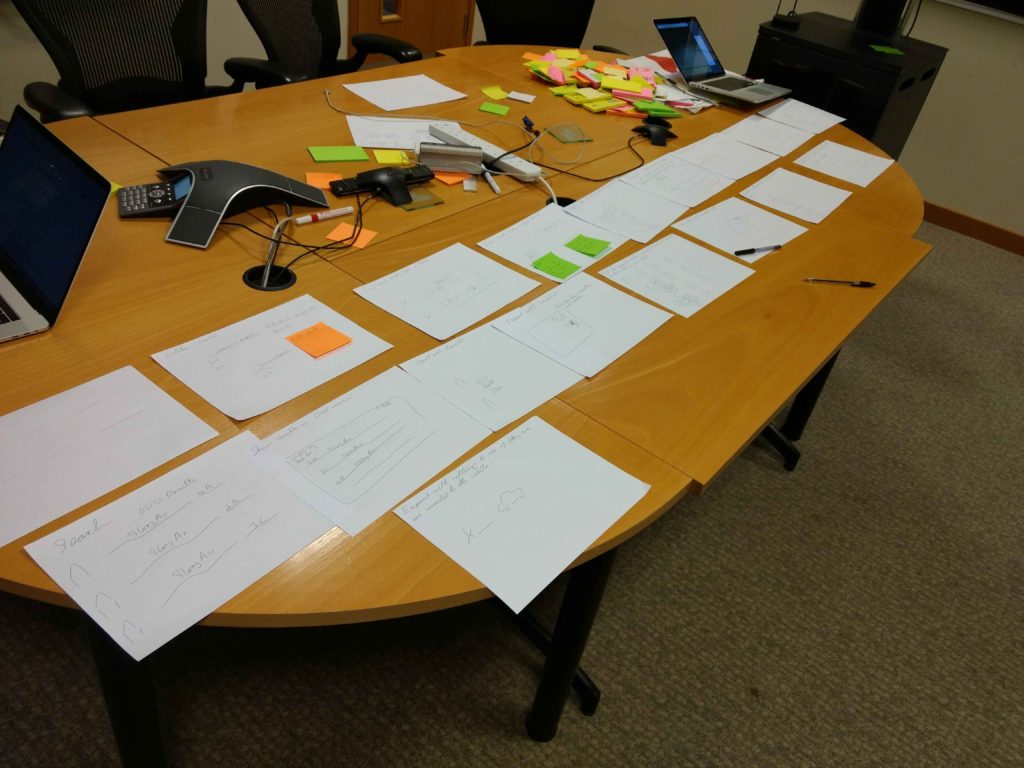
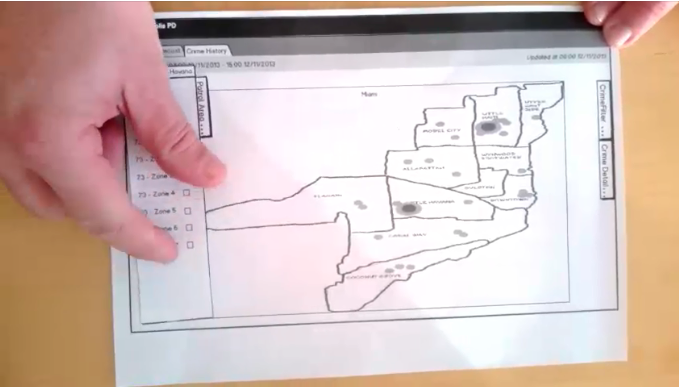
I created paper wireframes to exercise the concepts which allowed a lot of ground to be covered as I learnt and looped with user validation sessions.
Using a paper prototype to experiment with walk-up-and-use interactions
Prioritise for maximum impact
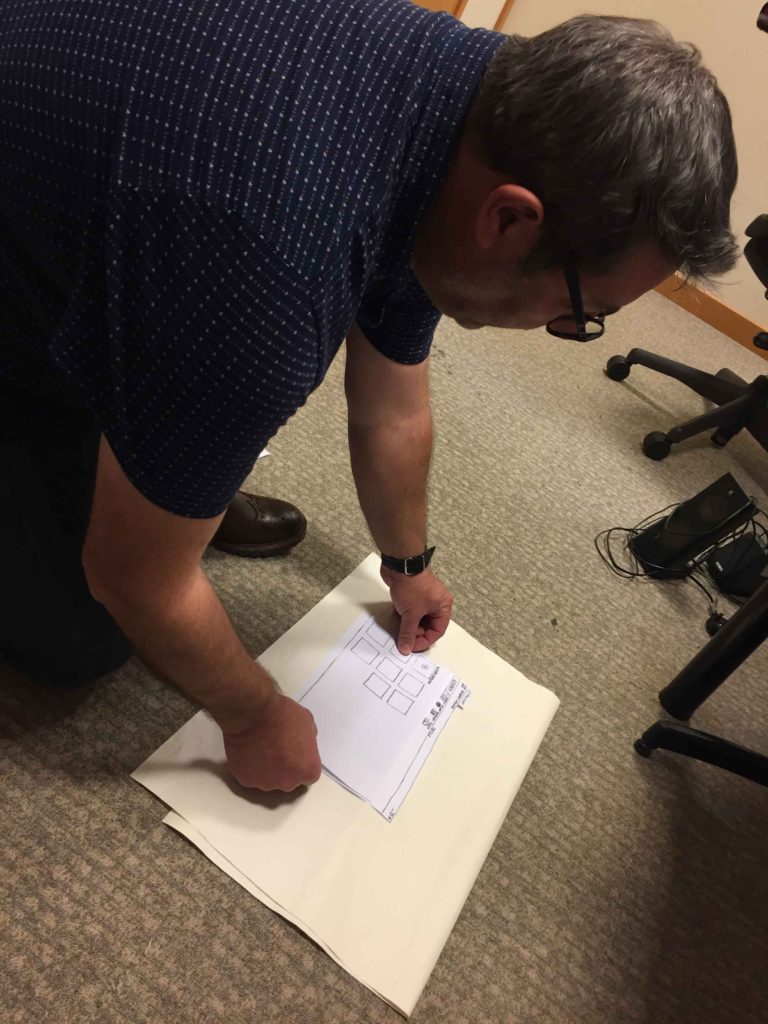
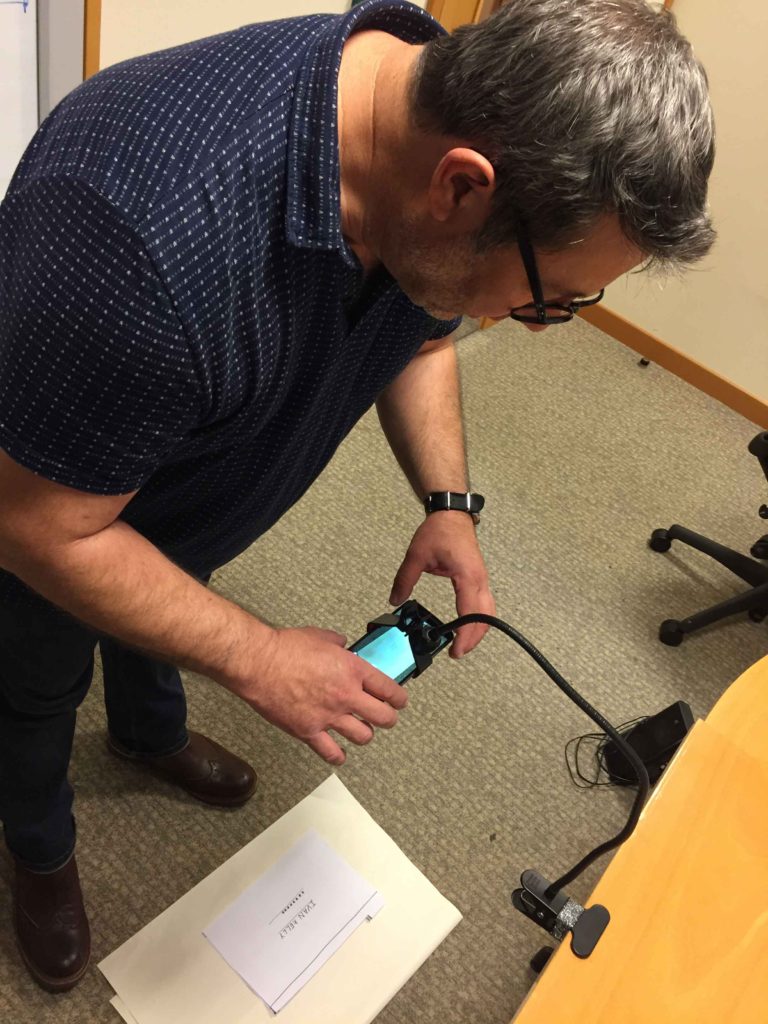
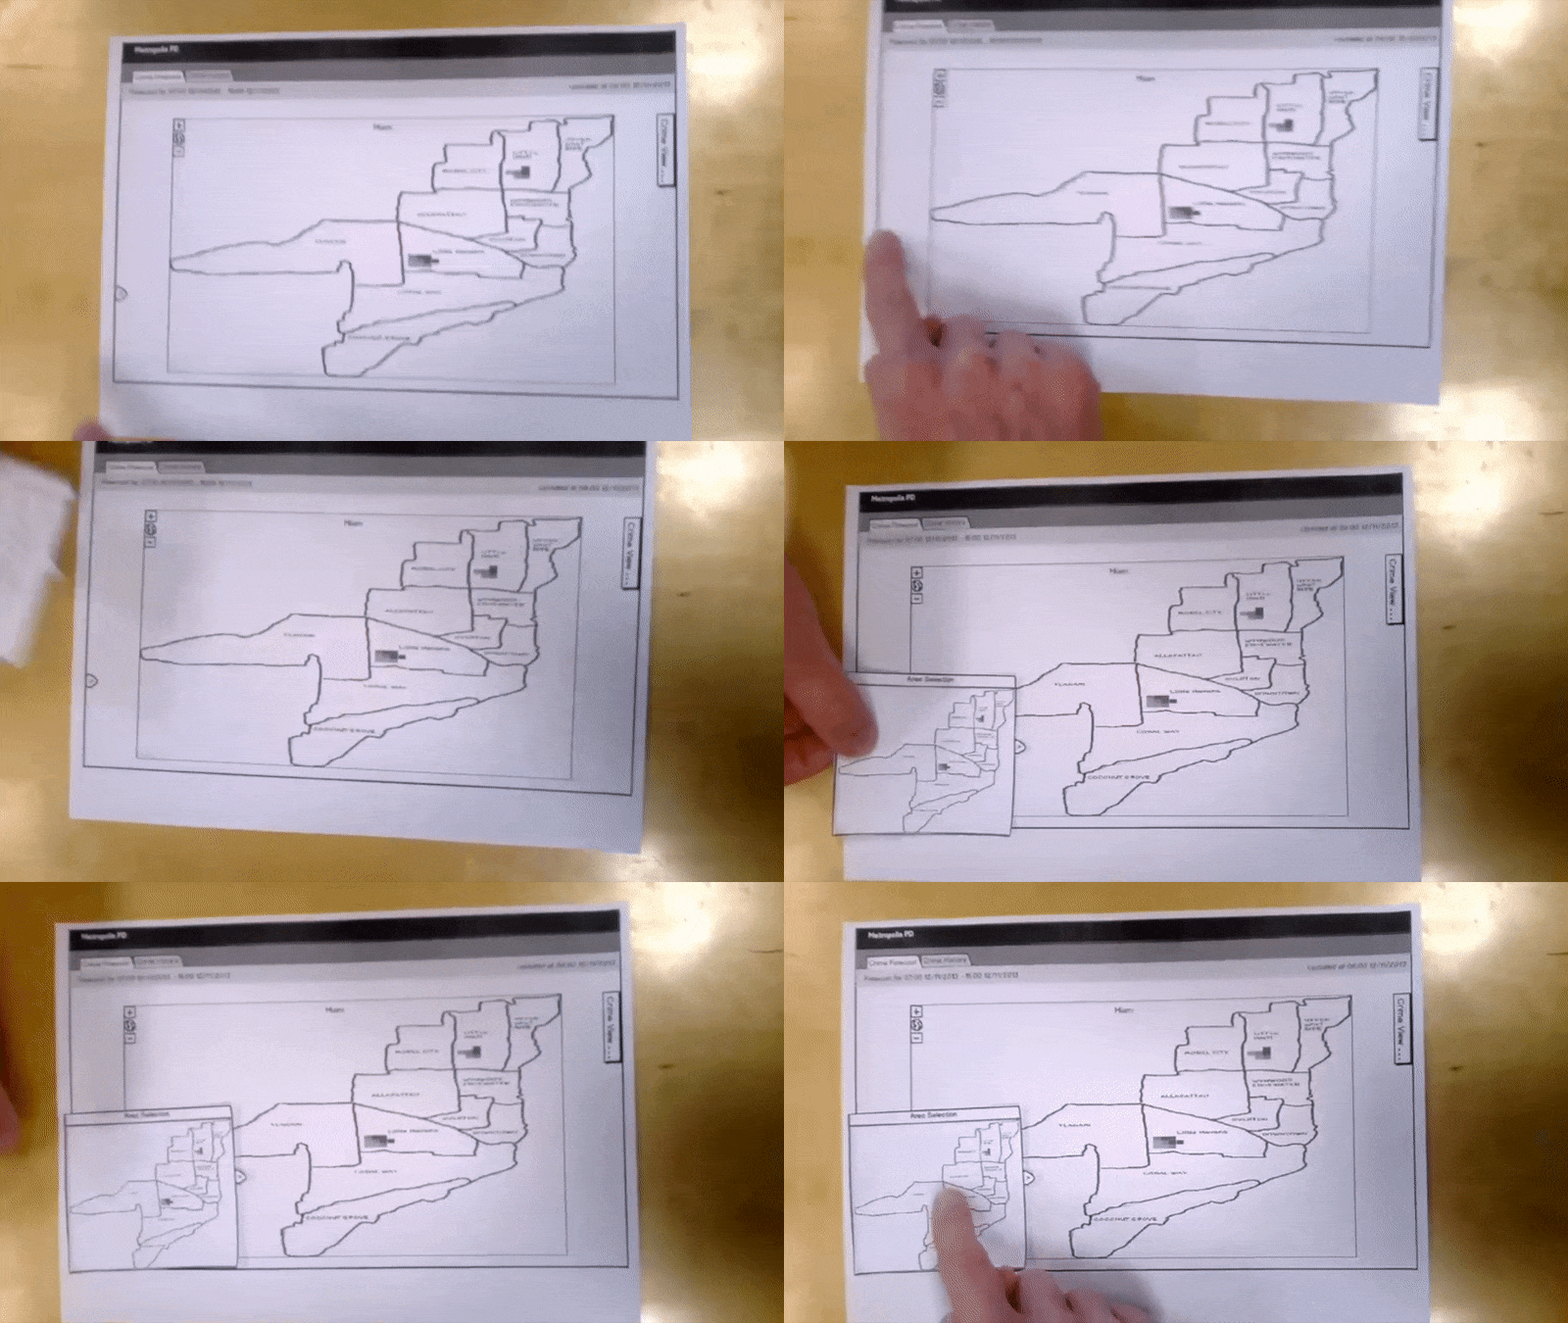
I put together animated videos of the paper prototypes for use in regular on-line validation sessions with police department staff.
The sessions included analysts who had not been part of the project until that point. This was vital if I was going to get authentic feedback on the interface paradigms I had been working on.
Adding motion to a paper prototype to produce an animated wireframe for user playback
Designing for the sergeant
The team working on a day in the life of a shift sergeant
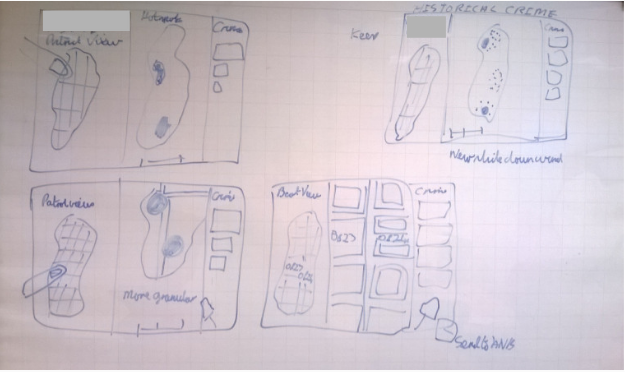
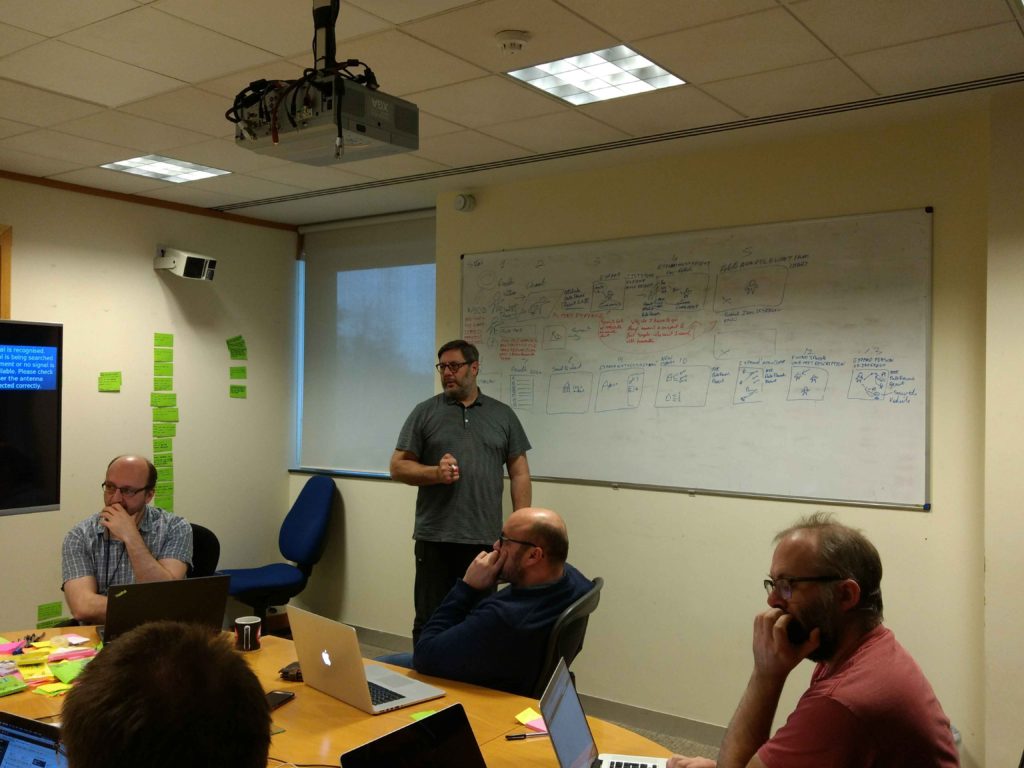
Any tool introduced into the shift briefing environment needed to be adopted by a busy sergeant and had to deliver a level of satisfaction in use that would immediately overcome early objectors.
I ran on-line user sessions testing the training wheels and walk-up-and-use interaction approaches. Almost all the users reported feeling more comfortable with walk-up-and-use interactions.
The users also had to undertake A-B testing to compare a direct interaction model, where they would interact directly with the map, to an indirect interaction model using a menu to drive actions on the map. The outcome was the elimination of the indirect interaction approach
Animated interaction modes for early testing sessions
Designing for the crime analyst
The analyst was taking up to three hours to produce crime predictions, which were getting to the morning patrols at 11am, nearly five hours into the shift.
A significant amount of time would be reclaimed by having the solution’s machine learning model output results in the early hours of the morning. But at least one third of the analyst’s time was spent manually completing intelligence products – see below.
Click image to enlarge artefacts collected from the PD

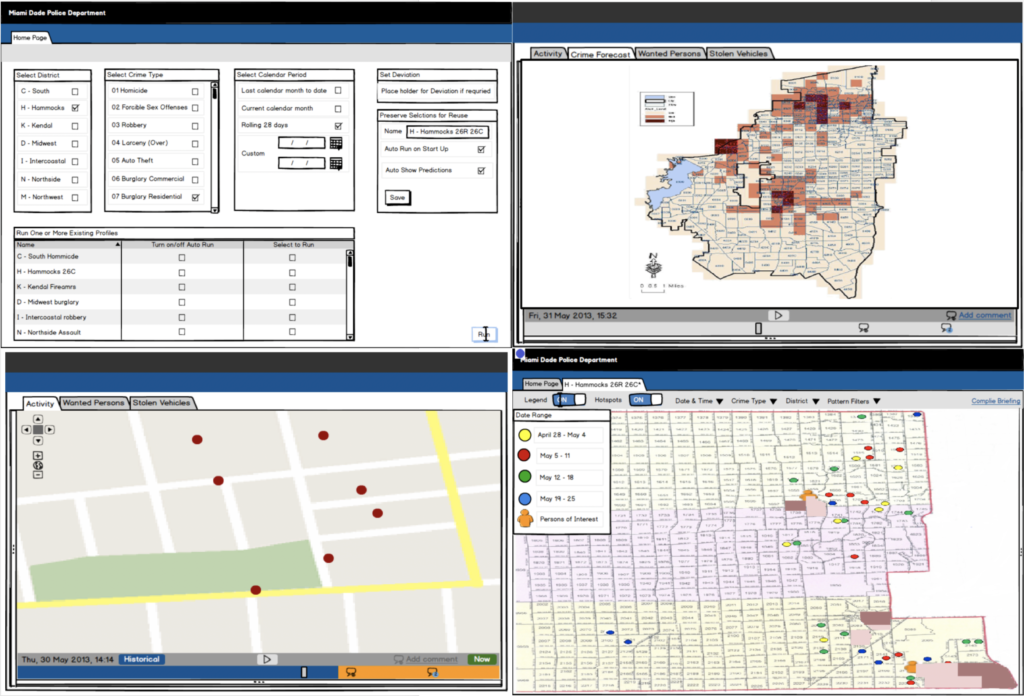
I created wireframes to demonstrate how the application could take the manual compilation out of the equation and used these to validate the approach via the online sessions with the police department.
Click image to enlarge
Stepping up the testing and validation
Validation had been on-going throughout the initiative, both for the experience and the machine learning models which, with their state maturation lead times, were significant time loops. With confidence in the design direction, the design work evolved into Hi-Fi functioning prototypes and the testing became task based.
Before testing the prototype with users from the police department, I tested it with two UK-based analysts. This gave me a good feel for how well formed the tests were.
This was also an opportunity for the team to sit-in on testing, something I always advocate and push for. The testing employed the standard measures for efficiency, effectiveness and satisfaction. In addition to the SUS questionnaire, a valence and arousal wheel was used to draw participants into verbalising their emotions at the end of each task.
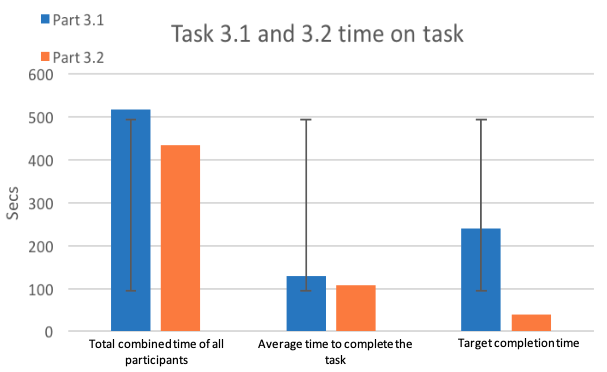
Measuring efficiency with time on task.
Measuring satisfaction post-test using the SUS questionnaire.
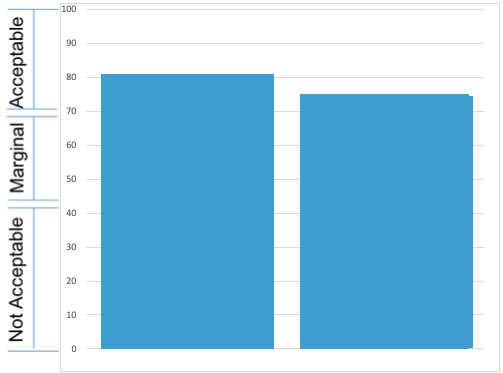
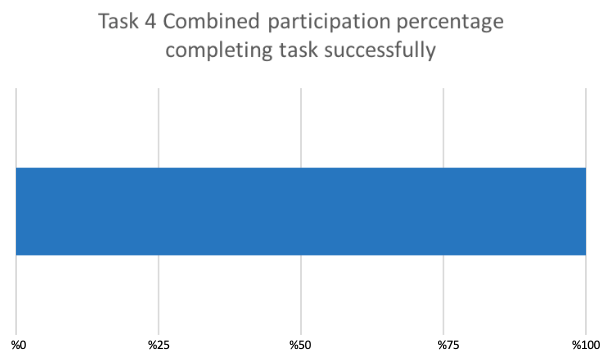
Measuring effectiveness with task completion rates.
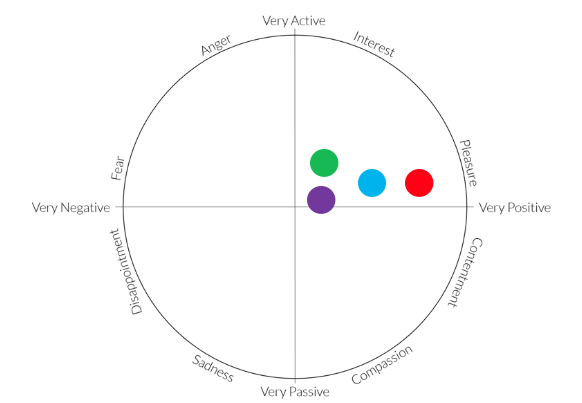
The emotion wheel gathered data points on the participant’s valence and arousal.
Only minor changes were identified during the testing, with results in-line with expectations, given the amount of design de-risking that had been undertaken throughout the multiple workshops and on-line user sessions.
Final design
Key screens from the final design
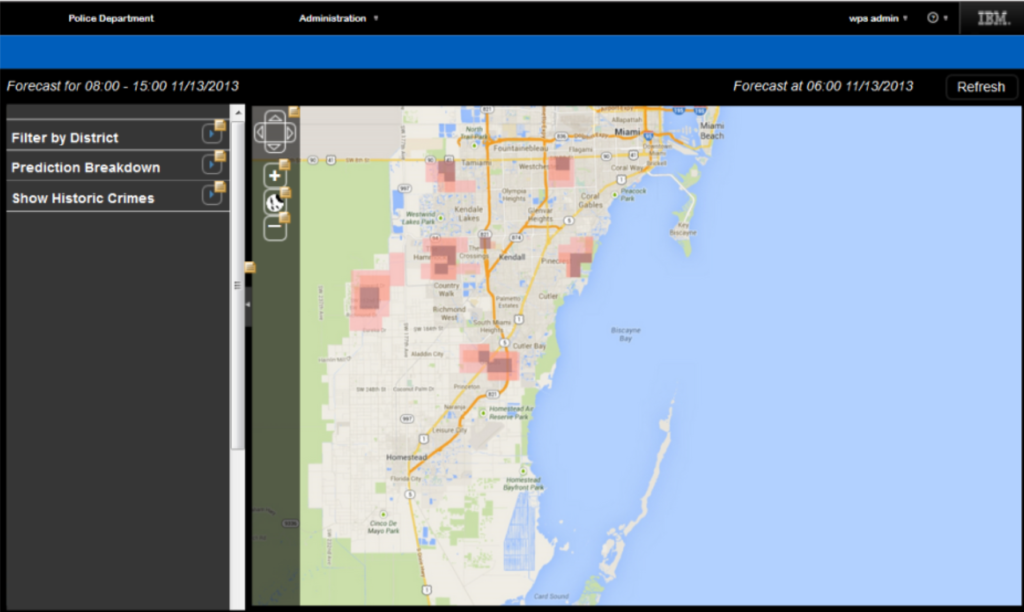
AREAS OF PREDICTED CRIMINAL ACTIVITY
At the start of their shift the analyst logs into the PD system knowing the predictive crime analysis solution has already give them back three hours of their day.
Click image to enlarge
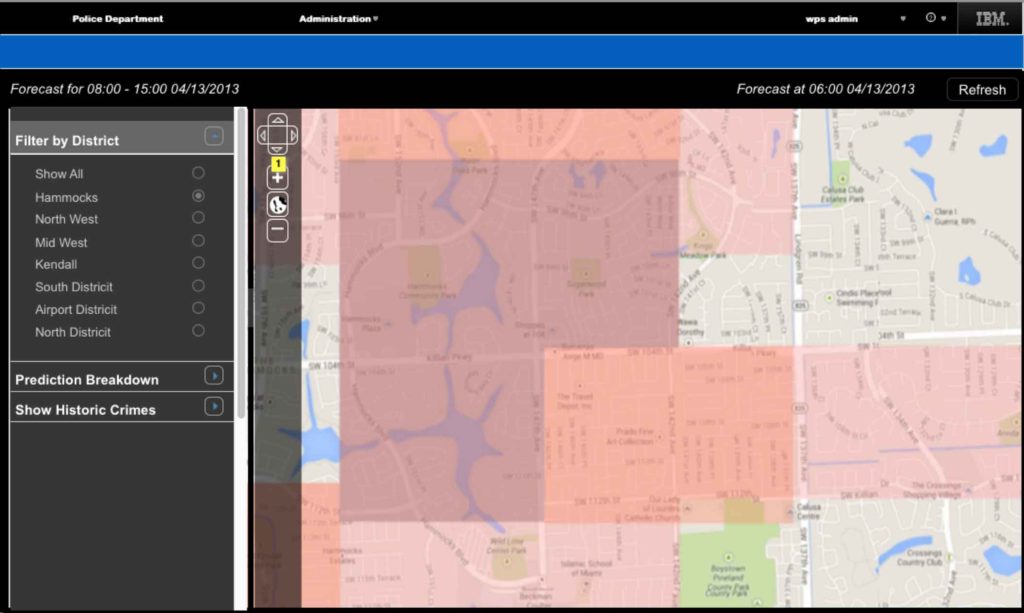
FORCE MULTIPLIER
If the predictive crime analysis app could give the analyst back three hours for one precinct’s predictions it could give exponential time savings by running predictions for all the department’s precincts.
Click image to enlarge
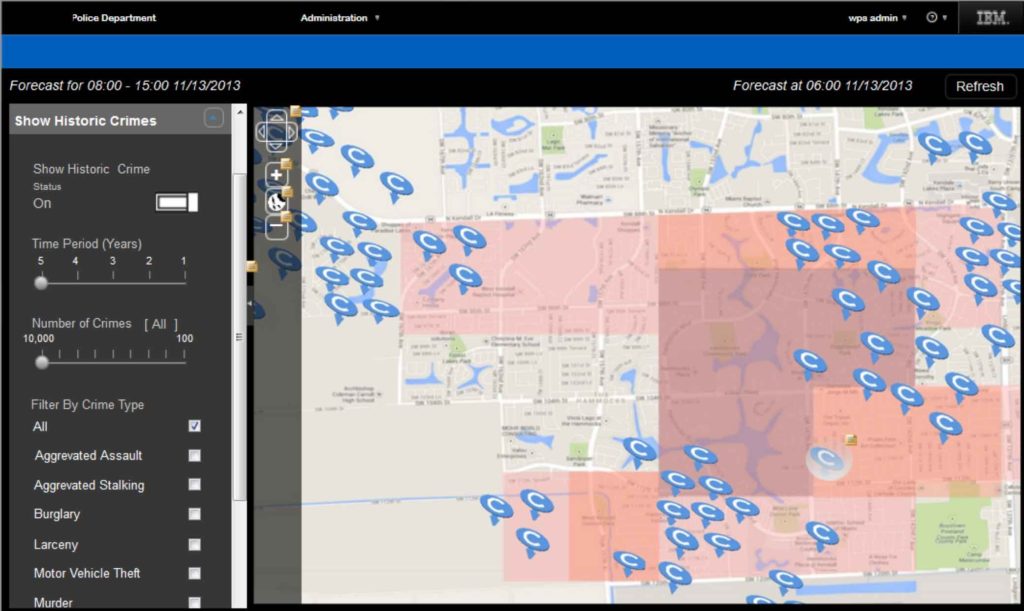
EFFECTIVE LEAD GENERATION
Placing historical crimes in context with predictions gives analysts additional insight into what prior criminal behaviour is associated with the predicted areas, assisting with lead generation.
The design was final, but the crime icons were an experiment to understand if more information could be accommodated with the pin heads tilted.
Click image to enlarge
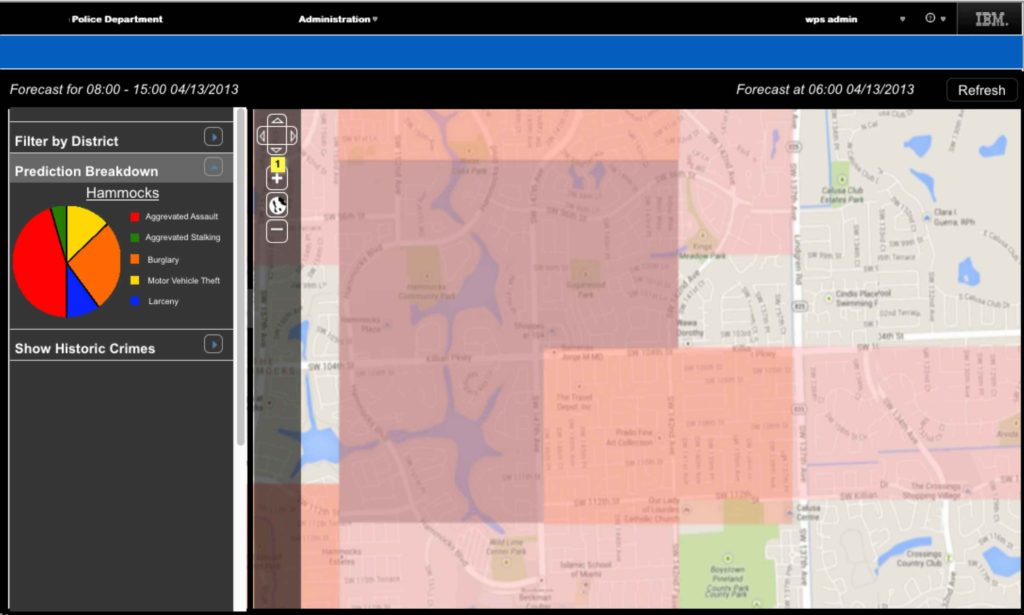
DETERRING MORE CRIMINALS
If the predictive crime analysis app could give the analyst back three hours for one precinct’s predictions it could give exponential time savings by running predictions for all the department’s precincts.
Click image to enlarge
Outcome
Predictive crime analytics makes the Super Bowl
One year after the start of field trials, the police department’s burglary crime rate had reduced by 16 per cent.Two years on from the POC, every Super Bowl viewer became aware of predictive crime analytics when it was given a big reveal in a 30 second advert, highlighting crime reductions of up to 30 per cent among participating police departments.
Super Bowl advert
https://martin-nathan.com/wp-content/uploads/2024/06/Police-Use-Analytics-to-Reduce-Crime-IBM-Commercial.mp4
Copyright © IBM – Safer Planet Campaign
